Instructions for using the online tool
Note: This tool works for Illinois region only. N-Tracking is only available from Nov 1st, 2015 based on the current availability of NWS weather data. Once a request is successfully submitted, simulations will run and the output will be sent to the user as an email.
Please follow the following steps to use the N-tracking online tool
- Go to the tool's login page
- If you have an account, use the login info to log into the system. Else, register a new account by clicking on the “Create Account” tab.
- If you want to log out, click on the “Logout” link. If you want to submit a simulation request, proceed to the following steps.
- After you have been directed to the requested page, input the following parameters:
- Select a corn Cultivar from the dropdown list or choose “add new” to add a new cultivar, if not provided in the list.
- If adding a new cultivar, cultivar name and relative maturity index (RMI) values (in days) must be provided for the new cultivar. The program will use RMI values to compute required cultivar parameters.
- Input the Planting Date and desired simulation End Date for the simulation request.
- Due to limited past weather data, earliest simulations can be run for 2016 growing season. Weather data prior to 2016 growing season will be added later
- Simulation end date cannot be before the planting date, or into the next year (no multi-years simulations).
- Input the amount of fertilizers applied at the location for the current growing period. The tool allows up to three Nitrogen Applications for a growing year. Select the number of fertilizer applications from the dropdown menu and provide the following information for each application.
- Fertilizer Application Date in mm/dd/yy(yy) format, e.g. 04/14/16 or 04/14/2016
- Rate at which fertilizer was applied in pounds per acre
- Fertilizer application Depth. Use the default value if not known
- Multiple fertilizer applications should be entered in increasing order with earliest application first and so on
- No fertilizer application is allowed after the simulation end date
- Note: If no fertilizer was applied, select a date within simulation period and change the fertilizer rate to 0
- Latitude and Longitude: Select the location at which nitrogen tracking is desired. This can be done either by clicking at the desired location in the interactive Google map or by typing in the coordinates in the respective fields.
- Finally, click on the Submit button. Your request will be processed, and an email will be sent containing the results (Fig. 1). The results include a graph of soil nitrogen availability (lbs/acre) as it changes during the simulation period in two soil depths - 0-1 and 1-2 feet, and total nitrogen concentrations in both depths.
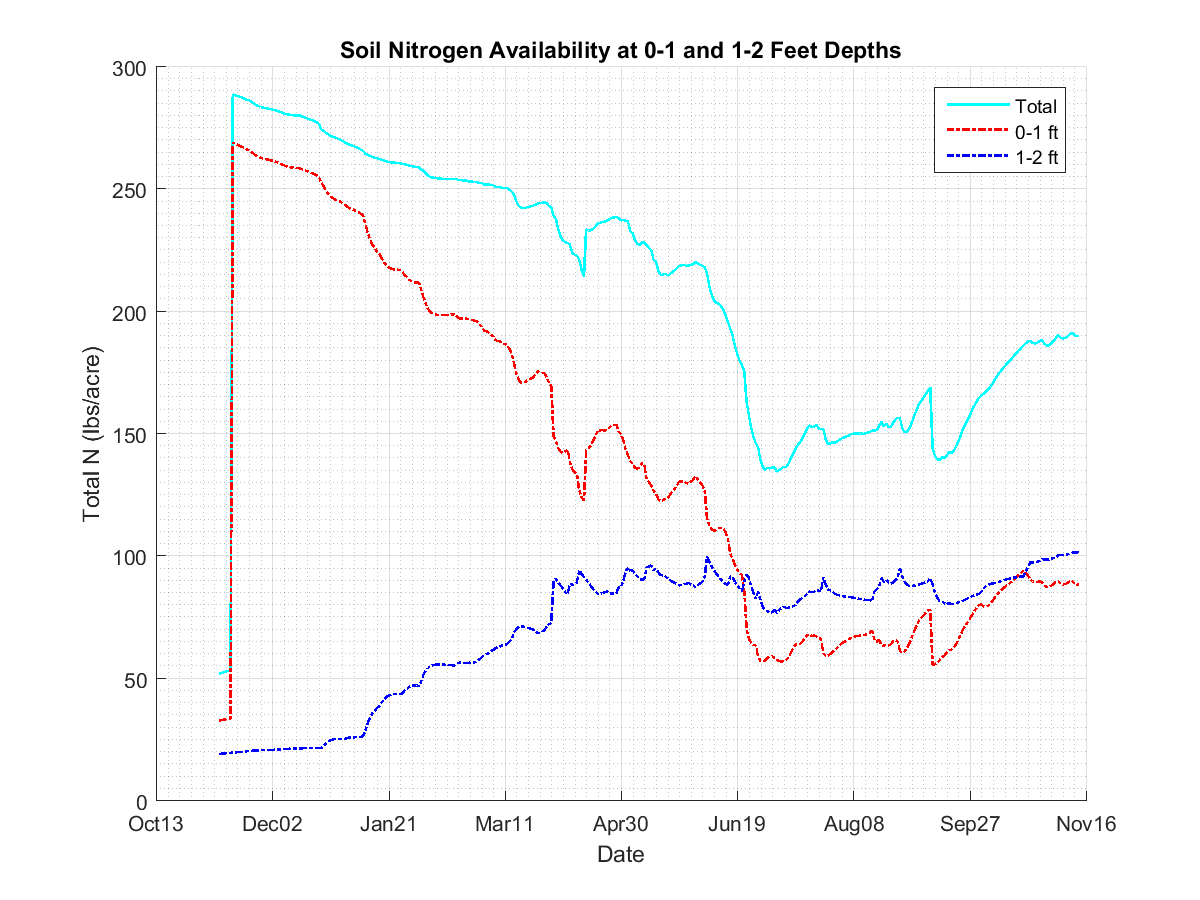
Figure 1. Sample output sent to the user. Click to enlarge
If you have any questions about the tool, please email:
wangjim@illinois.edu